![[object Object]](https://umsousercontent.com/lib_CUsguFEVafmoKCKW/ns6hm1s6vu8ctynd.png?w=334)
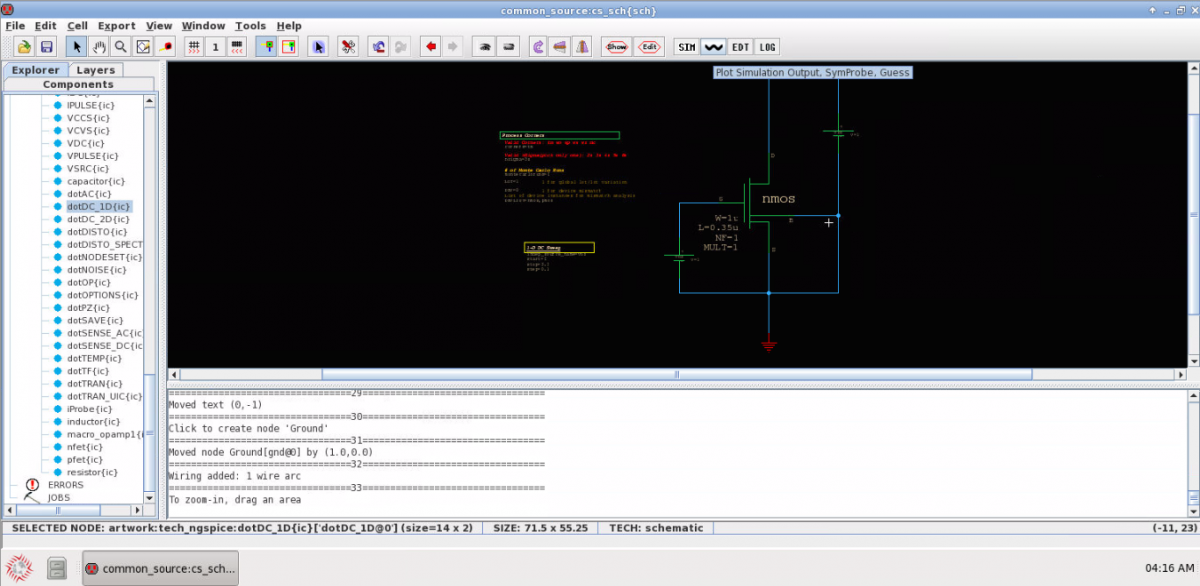
- Use symprobe to view waveforms from ngspice output raw files. Launch from Electric toolbar wave button, or a terminal.
- Use File menu to open additional windows for additional raw files (i.e. other corners).
- Drag-n-drop selected traces between symprobe windows, to show results from multiple separate corners on one plot.
- see also: Save/reuse traces & calculations
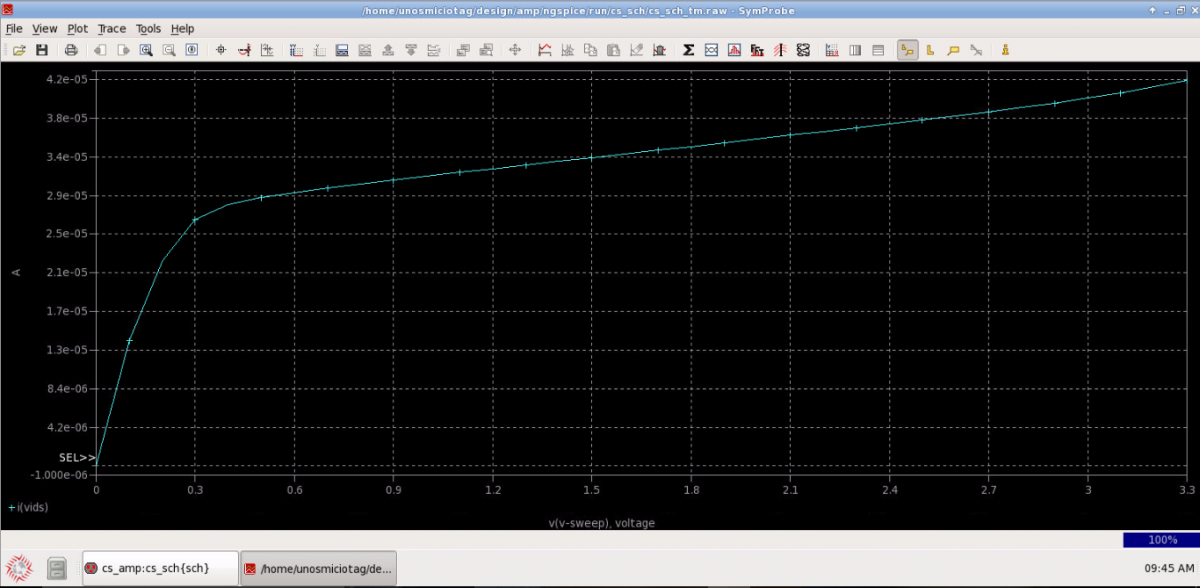
1. After simulation, ensure that it did not fail by checking the log file(s). To view waveform, click on the wave button.
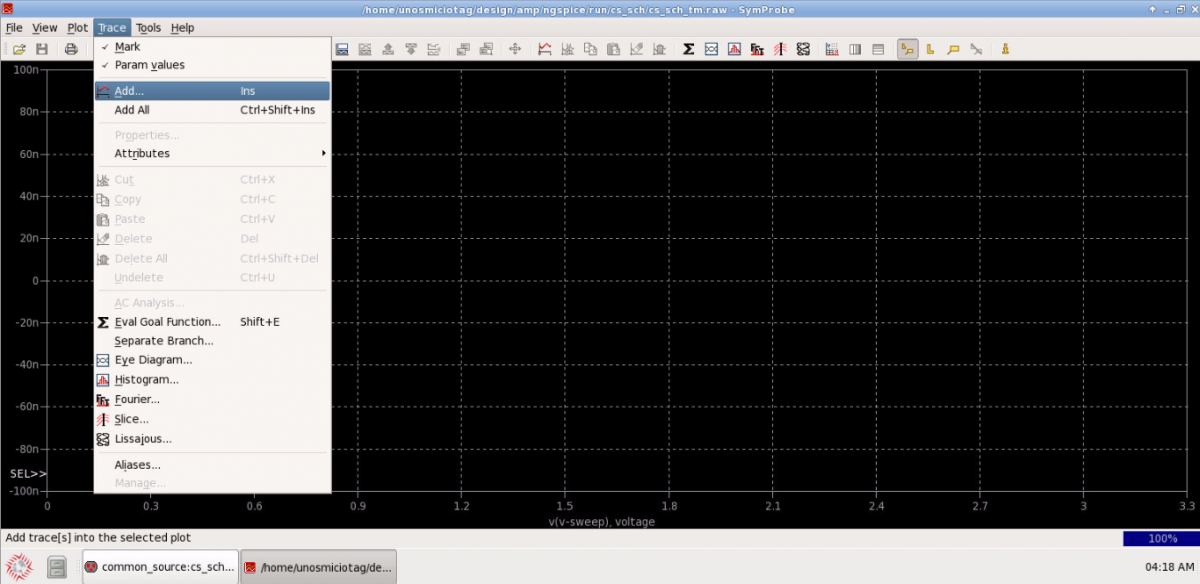
2.This opens Symprobe. To add waveforms, Trace -> Add.
Note: For an AC-Analysis, the Trace menu offers an easy way to plot Phase, Magnitude, and db20; that also become usable in other calculations.
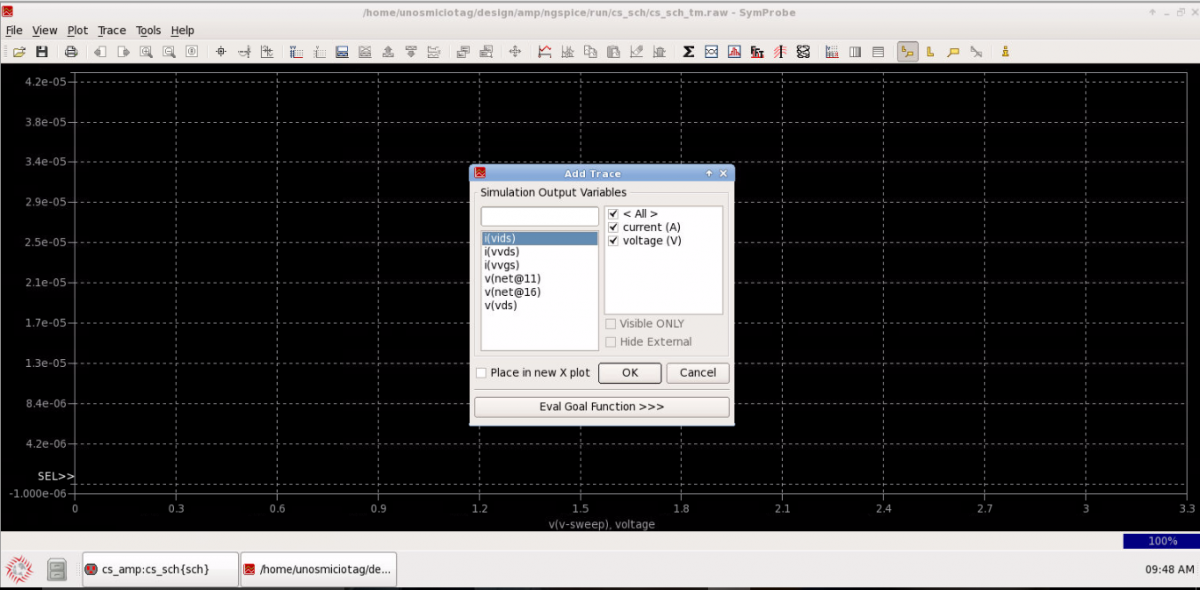
3. Select the signals to be plotted. You can also write equations to display (Eval Goal Function).
4. View the behavior of your circuit simulation and verify the functionality